|
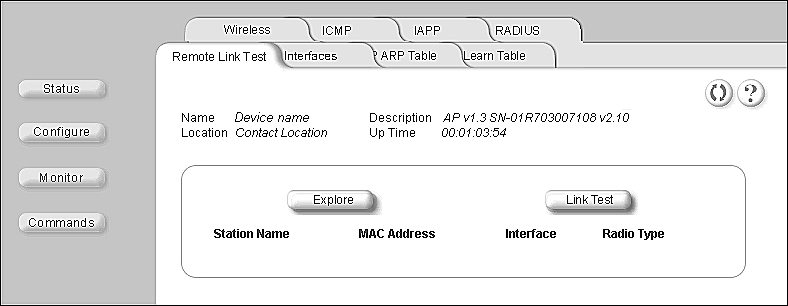
To observe the AP-3 network statistics, click on the Monitor operation button. Result: The Monitor screen appears. Each tab contains information for specific network aspects.
Figure: Monitor Screen

Network monitoring categories include:
- Wireless. This tab identifies network frame and fragment statistics for both Slot A (PC Card A) and Slot B (PC Card B).
- ICMP. This tab provides message related information for both received and transmitted messages directed to the AP-3 (does not count all network traffic).
- IAPP. This tab displays statistics relating to client handovers and communications between Access Points.
- RADIUS. This tab provides RADIUS authentication information. RADIUS authentication must be enabled for this information to be valid. To enable RADIUS authentication, please refer to "Configuration" of this guide.
- Remote Link Test. This tab displays information on the quality of the wireless link to clients and other AP-3 units in the wireless distribution system. To find wireless clients connected to the AP-3, click Explore, then the Refresh button. To test the link quality, select a station, and then click Link Test. Quality is measured in terms of Signal strength, Noise strength, and the Signal to Noise Ratio (SNR).
- Interfaces. This tab displays information for the Ethernet interface, as well as each PC Card interface.
- IP ARP Table. This tab provides information based on the Address Resolution Protocol (ARP), which relates MAC Address and IP Addresses.
- Learn Table. This tab displays information relating to network bridging, specifically, the MAC Address and interface number.
|


